by Grzegorz Stefański | Jul 23, 2024 | Politics and Social
The world has been living for the past two days with the news that Joe Biden has resigned from running for the US presidential election. The statement was posted by Joe Biden on July 21, 2024 on the X platform, and it triggered countless comments.
Statement full of emotions
We intend not to get into the motives behind this decision, or what effects it will have on political grounds. We wanted to see what kind of emotions President Joe Biden included in his statement and what kind of emotions might accompany the statistical US citizens reading it.
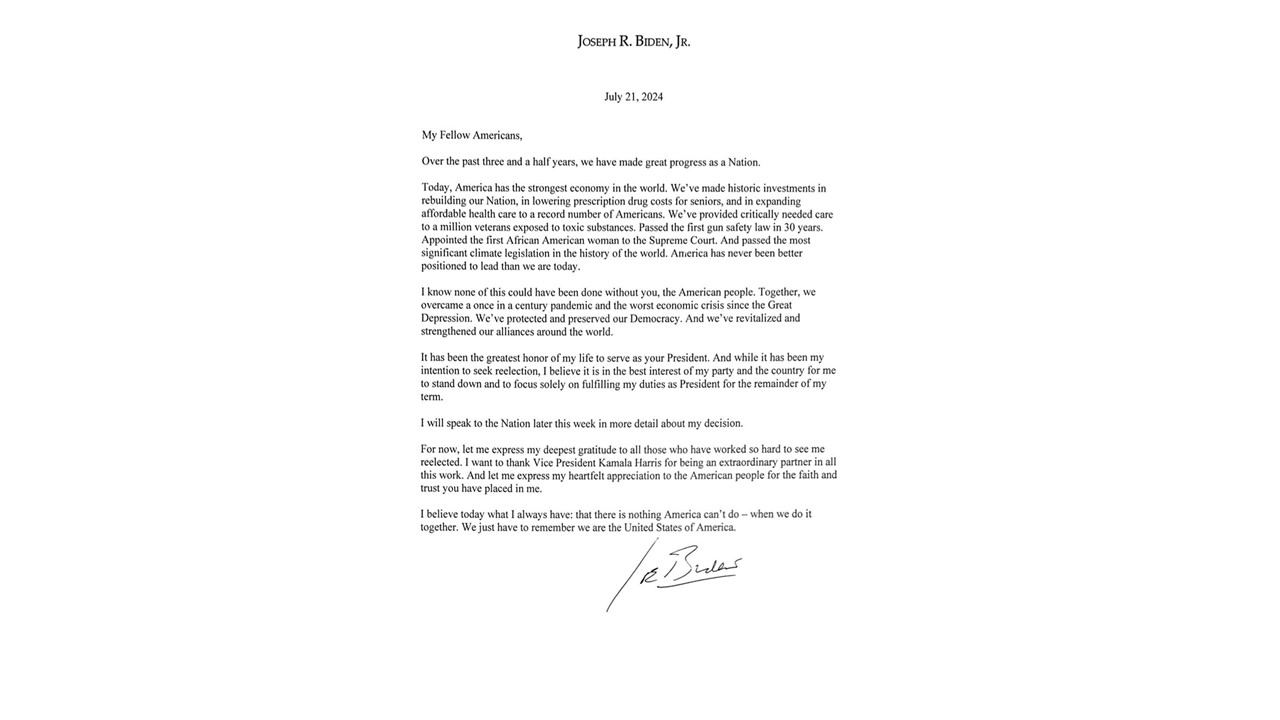
Source: https://x.com/JoeBiden/status/1815080881981190320
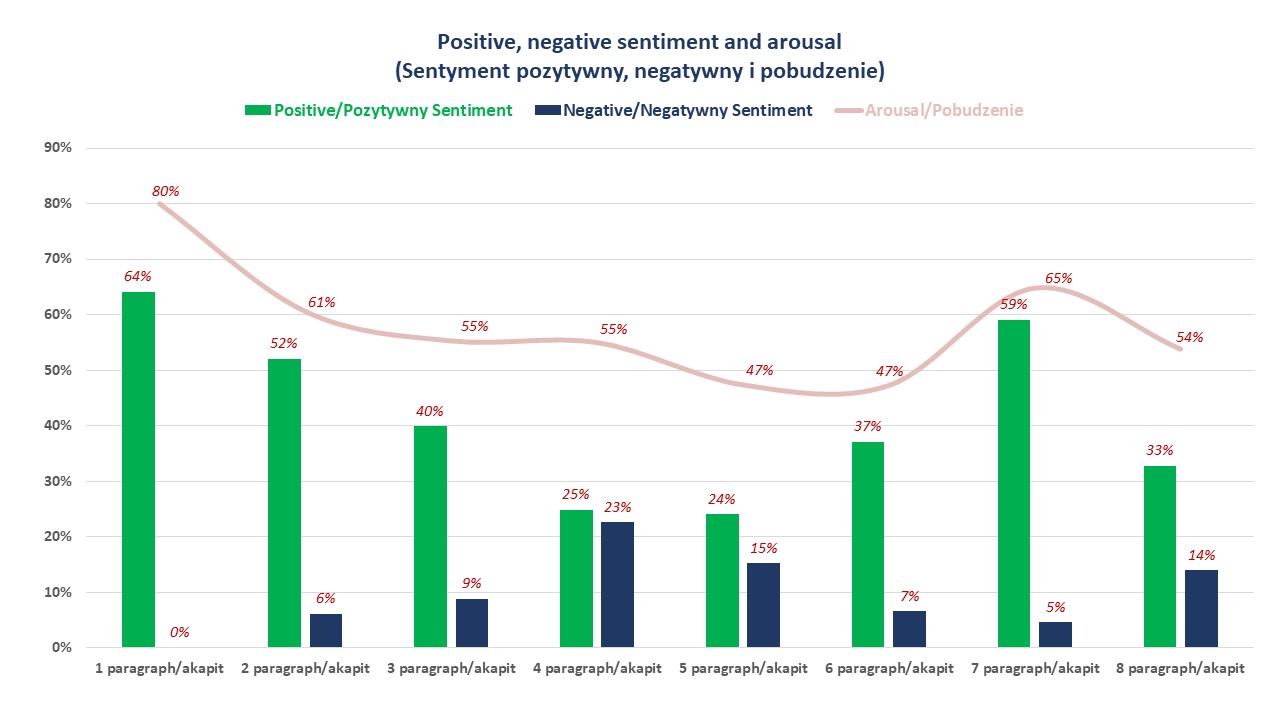
First, we measured the level of arousal and sentiment
Analyzing the content of President Joe Biden’s statement, one can see that it was imbued with positive sentiment and a high level of agitation. The level of agitation may indicate a high personal commitment to the President in the content conveyed in the statement. One more fact should be emphasized. The decision to resign as a candidate should necessarily evoke emotions in Joe Biden that create a negative sentiment, but this is not evident in the sentiment analysis. The content of the statement is filled with positive sentiment, and this is probably how it is read by the statistical viewer.
What emotions were dominant
The sentiment picture is influenced by individual emotions and their intensity builds its level. Analyzing the statement as a whole stands out on the side of emotions considered positive emotions of trust and joy. In the latter case, joy should be understood as a feeling of satisfaction. On the other hand, among the negative emotions, the highest intensity was recorded for sadness and fear (read in this case as anxiety).
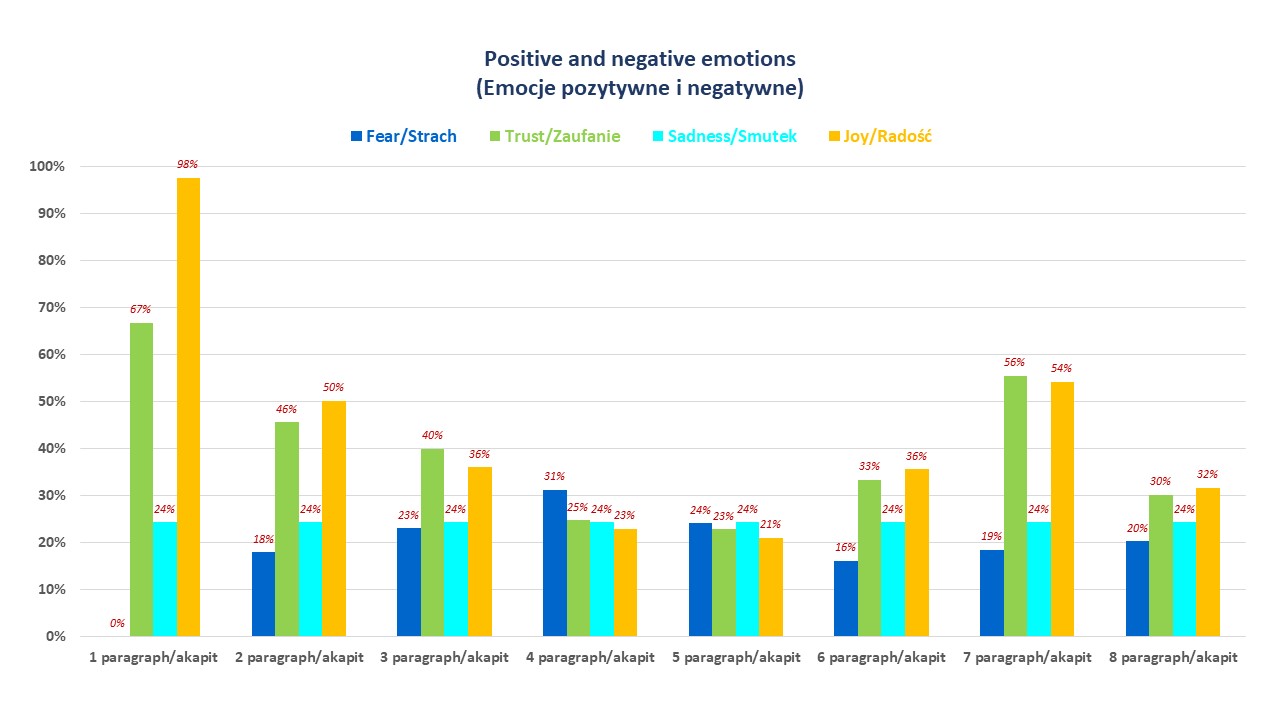
As you can see, only in two paragraphs of the statement, the intensities of the emotions of sadness and fear (concern) are comparable or slightly higher than the positive emotions. In the fourth paragraph, when the President mentions the time of crisis caused by the pandemic – here fear (apprehension) stands out. In contrast, in the fifth paragraph when he writes about his resignation from running for re-election, sadness stands out. In the remaining paragraphs, the positive emotions far outweigh the negative ones. This state of affairs means that the entire statement can evoke a positive sentiment in the audience. Here, we point out that when we speak of the recipients, we mean the statistical recipient (without going into their political preferences).

by Grzegorz Stefański | Apr 8, 2020 | Sentistocks
We have chosen the worst possible moment to start forecasting cryptocurrency prices, namely the Bitcoin forecast. This largest and perhaps most important currency in the world of crypto has never been particularly stable. The situation related with the COVID-19 spread, on the other hand, increased only the exchange rate fluctuations. The drop from over 9,000 USD to just over 4,000 USD in such a short period was, even in this world, unprecedented. But who could have foreseen it. And besides, we once had to start 🙂.
How do we predict the changes in exchange rates? We have already revealed the secret in the read “Sentiment or emotions on the crypto stock market?“. We decided to publish on our Facebook fan page the forecast course every day. By doing it, we wanted to show the effectiveness of Sentimenti predictions. That is why we created a Sentistock group on Sentimenti’s Facebook profile in early March. At the same time, we had the last internal arrangements concerning the scope and form of publication. The first premiere entry appeared on March 16th and it continues until today.
The standard daily signal contains the following data:
- Fixed average price measured from 24 closing prices, calculated each time for a full hour, fixed at 16:00 on the day of publication;
- Average daily rate of exchange, calculated until 16:00 the following day;
- Number of mentions taken into account.
In the comments section we publish information about the accuracy of our prediction.
Well, this is probably what interests you most. There you go then:
The Bitcoin forecast: how our effectiveness did work out
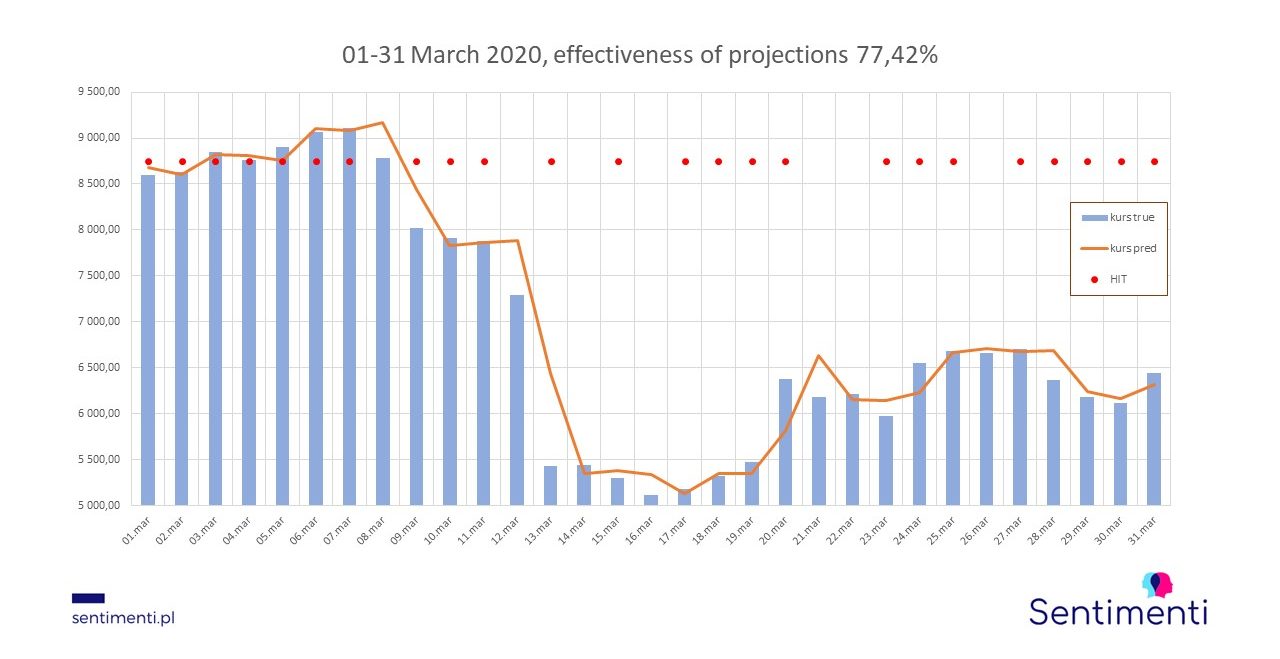
For the whole of March 2020, the effectiveness of the trend change prediction was 77.42%. For the shorter period, which was published on the Facebook group (i.e. since 16 March), the effectiveness was 75%.
What data do we analyse before we make a prediction?
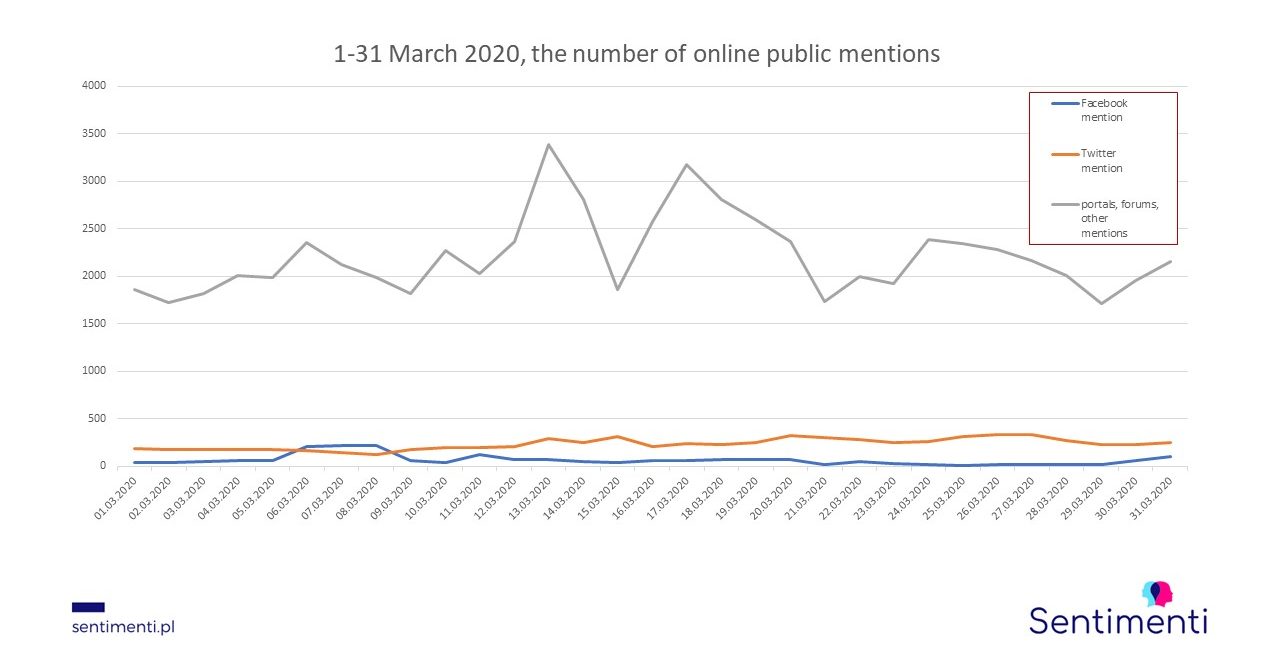
Concluding, throughout March we collected 77 923 mentions from such sources as: Facebook, Twitter, internet forums, websites and blogs. The daily average analysed by us is about 2 500 mentions. Any extra reflections? There is one: Twitter is the individual medium that stands out.
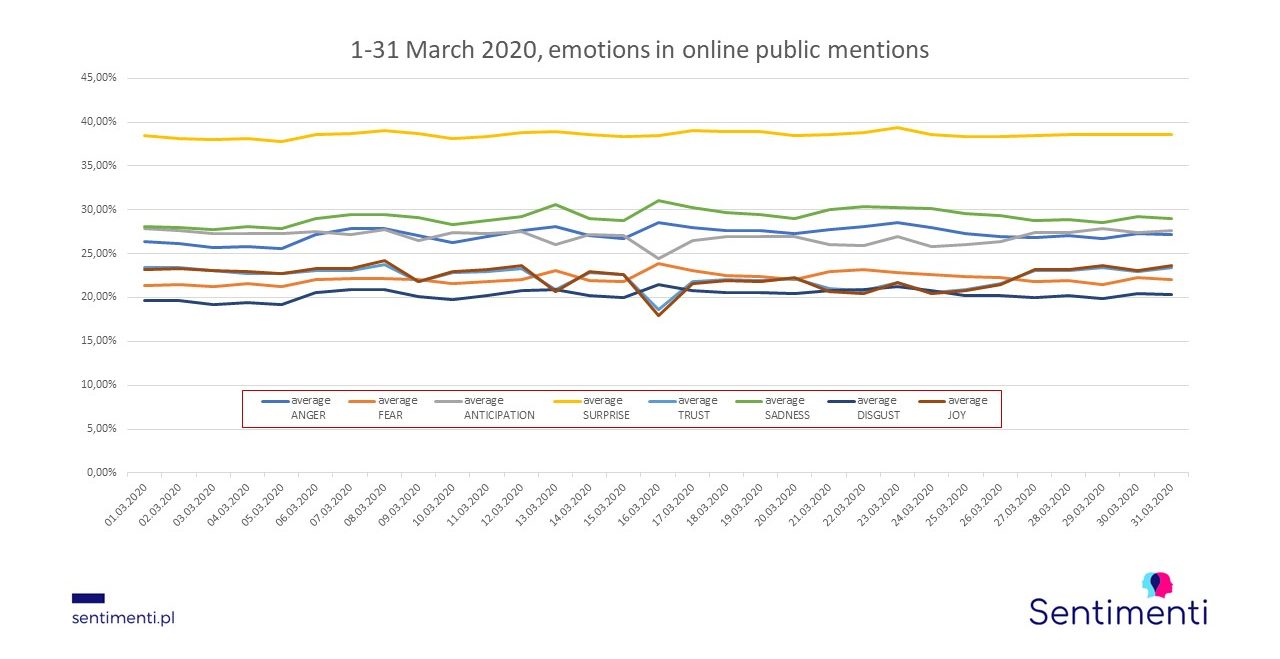
Finally, the collected data sets up the material that is analyzed by Sentitool, by the most important part of our prediction model, the so-called regresor (analyzer of 8 emotions, positive and negative sentiment and arousal). Those more interested are referred to a few articles on our blog.
Probably April will turn out to be more demanding. Moreover, the situation around COVID-19 spreading around will be felt also in cryptocurrency courses. Any way, we will certainly keep you informed about it! 🙂

by Grzegorz Stefański | Jan 30, 2019 | Sentistocks
There are many tools for monitoring companies’ economic situation. A number of them are “sensors” for early warning of problems. At the same time, they provide information about phenomena beneficial for companies. In most companies, there is a regular problem of sales decline. The management then looks for the causes that affected this phenomenon. The question is if it could have been foreseen.
ORBIS S.A. in the third quarter of 2018 – crisis example
Similar doubts were probably raised by the shareholders and – more likely – the heads of the ORBIS S.A., whilst looking at the financial statements for the third quarter of 2018. For this period, the aforementioned company recorded a decrease in revenue for both in comparison with the second quarter of 2018 and in comparison with the third quarter of 2017. Such a phenomenon appeared for the first time since many years (which pictures the table below).
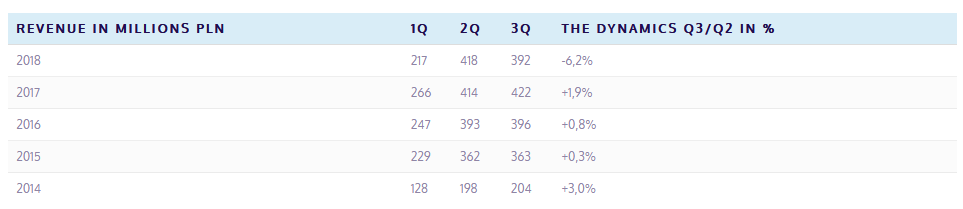
source: own work based on Bankier.pl
Probably, it was already during the third quarter of 2018. A number of indicators used internally by the company signalled a possible problem of a sales drop, yet in this area there certainly was no analysis of changes in the intensity of emotions in texts published in the press or social media about ORBIS S.A. In other words, there was no analysis of emotions that the recipients – i.e. customers – evoke even seemingly neutral references to the company.
Emotions towards Orbis and the financial crisis
Even a simple sentiment analysis of this period shows there was a substantial decrease in positive feelings among the recipients of texts about ORBIS S.A.

Changes in sentiment in the references to Orbis S.A.
Stopping with this simple analysis will not necessarily answer the question of which emotions caused the positive sentiment to adopt a downward trend. However, using the SentiTools to analyse the entries about Orbis, we can check the emotions contained in the notes, comments, mentions, etc. from that period.

Analysis of the emotions of the Orbis S.A. records
Monitoring of emotions allows us to predict the crisis
It is clear that in the time lapse between July and August the intensity of emotions defined as anger, sadness and repulsion noted a growth. Such emotions expressed by potential customers may have a negative impact on the amount of generated revenues. It would be interesting to impose on the lines of intensity of the above emotions the dynamics of revenue growth in this period (unfortunately, such detailed data are only held by the company). Without this solid information, in our analysis we can only relate it to a measurable indicator which was the share price of ORBIS S.A. on the Stock Exchange.

Emotions and share price
The chart above clearly shows that the emotion intensity peak with a negative correlation to the share price appeared at the end of August and preceded the jumping drop in the price of ORBIS S.A. shares. Interestingly, in total, the intensity of emotions with a negative correlation to the share price was determined by the previously mentioned emotions of disgust, sadness and anger, which recorded values of correlation coefficients of -0.82; -0.61; -0.59 respectively.
The following scale of correlation is usually assumed in statistical analysis:
- 5 <= rxy < 0.7 correlation high
- 7 <= rxy < 0.9 correlation very high
Emotions and stock market analysis
Thus, with a high degree of probability, in this case the emotions of disgust, sadness and anger expressed in the mentions of the company had a fundamental (apart from economic reasons) influence on the company’s course on the WSE. Further to that, by setting the trend lines for the intensity of emotions, it could be assumed that the process of the ORBIS S.A. share price decrease after a short adjustment at the end of September should take a downward vector. What actually took place. The culmination of the fall took place after the company published its financial results for Q3 2018.

Orbis S.A. share price
source: Bankier.pl

by Grzegorz Stefański | Dec 21, 2018 | Sentistocks
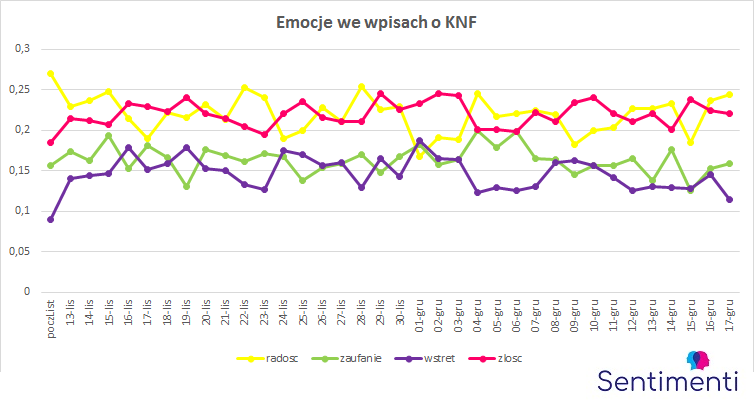
This time the article was prepared by Grzegorz Stefański, our financial advisor. He proposed to check whether the emotions expressed in the entries about KNF (Financial Supervision Authority) will allow to predict changes in bank indices.
In Brand24 tool we collected data from the period from 1 November to 17 December. As there was not much writing about the Supervision Authority before 13 November, we treated these 12 days as one starting point for data to which we compare further changes in sentiment and emotions expressed by Poles. As can be seen in the chart, before 13, about 200-400 mentions were written daily. On the day the scandal broke out, the number rose to over 20 800 and until today it did not fall below 700 (the least talk was about the KNF on December 5).

The banking sector on the Warsaw Stock Exchange has always been regarded as one of the more stable and relatively insensitive to sudden fluctuations. However, this stable sector is not immune to sudden turmoil, either. For nearly two months now we have been able to follow the events related to the so-called “KNF scandal”. It is clear that the situation in the KNF was very important for the banks’ listing on the WSE in the form of at least two stimulators.
The first one is media information about a conversation between the then President of the KNF and the owner of Getin Bank. The second is the detention of former members of the KNF management. It was November 13th and December 6th respectively. These events had the same resonance for the banking sector. When analysing the changes in the WIG – Banks exchange rate in that period, we notice the following reaction of the stock market with some time delay. This applies to the WIG – Banks quotation on 16 November. On that day, one of the three lowest closing prices in a year (7161.54) was recorded, while on that day the lowest price in a year (7040.86). There can be no doubt that the reason for such a significant decrease was the media information about a conversation between the then President of KNF and the owner of Getin Bank. However, the banking sector itself defended itself with results in the following days, which resulted in an increase in the exchange rate, which was not weakened by reports of the arrest of the President of KNF by law enforcement authorities (this took place on 27 November). In this period, a mini upward trend in the exchange rate is noticeable. However, further information on the arrest of former members of the PFSA management on 06 December resulted in a significant drop in quotations – to the level of 7244.17 (on 11 December).
 Source: bankier.pl
The question should be asked how the bank shares market will develop further? How much more turbulence is it able to withstand without causing negative reactions from stock market investors? Analysts often use the term investor moods – but what really makes up these so-called moods? Certainly, they are positively influenced by economic results, and also undoubtedly by investment safety. But investors are people who, regardless of measurable indicators, are also guided by emotions. The stock exchange is not free of emotions – we have seen it more than once. Also, the recent events related to the PFSA had a direct impact on the banking sector listed on the WSE. These events described by the media evoked certain sentiment and emotions among the recipients, and this could undoubtedly influence their behavior, causing for example the desire to get rid of their values.
At this point it is worth analysing – as a coincidence – the changes in the intensity of sentiment in the texts on KNF compared to the changes in the WIG – Banks exchange rate between 9 November and 17 December 2018.
 Source: bankier.pl / sentimenti
Analysing the above chart one can notice a certain correlation between the changes in the intensity of sentiment in the texts about KNF and the behaviour of investors manifested in the WIG – Banks exchange rate fluctuations. Thus, in a situation when the positive (increase) and negative (decrease) sentiment curves were aiming to cross, it was a certain signal to increase the bank share price. It took place on 16 November and from that day onwards the price rose until 29 November. On that day the sentimentary curves spread out and a short-term price drop was recorded. After that day, the curves entered the convergence phase again and the price went up (until 05 December). On the next day (after information about the arrest of former heads of the Polish Financial Supervision Authority), the exchange rate fell. The sentimentary curves entered a phase of retreat and the exchange rate adopted a downward trend until 11 December. After that day, the sentimentary curves came close, and the exchange rate entered the upward phase again. However, since December 13th, the positive sentiment trend has seen a decrease (and at the same time an increase in negative sentiment), and this may suggest that in the following days there may be another downward correction of bank share prices.
In this analysis, only one element has been adopted which may affect the share price levels of banks listed on the WSE. This element is media information about the situation in the PFSA. However, it already gives some premises to start observing carefully and trying to study the emotions connected with the capital market. A more complete picture can be obtained by conducting broader research, especially of the basic emotions that function in the environment of investment processes taking place on the stock exchange.
It is still necessary to consider how individual emotions have changed responding to subsequent reports of irregularities in the PFSA and whether they also have predictive power. The graph with the results of the averaged daily emotions indicates, first an increase in the proportion of disgust and anger and a decrease in joy. Strong fluctuations of trust can also be observed. SentiTool as a tool to help predict stock market trends? It seems that this is quite a possible scenario.