by Sentimenti Team | May 9, 2019 | Lifestyle
Fashion brands are very popular on social media. When we analyzed the Facebook communication of banks, we didn’t think the topic would be so successful – it’s our most-read post. We hope that hints and tips for improving social media communication can be drawn from it – with an emphasis on “let’s not overdo the display of surprise in official posts.” Now we want to show that we can study emotion on fanpages from different industries, including fashion.
Fashion brands on Facebook
Social media is now the most widely used way to maintain daily communication with customers. Even if they don’t bring direct purchase profits (here a newsletter still works better) they influence the perception of the brand by the wide audience. In short, they set a tone, including an emotional one.
We took a look at the Facebook activity of several Polish brands throughout 2018:
-
- high-profile (Vistula, Monnari),
- casual (Reserved, House, H&M),
- youth (Cropp / LPP),
- patriotic (Red is Bad).
We assume that the tone of their posts will vary, after all, brands want to create their image and react to who they are or what their audience is doing. First, we had to select a few companies with active followers. To do this, we compared the numbers of likes and comments under their posts. The size of the bubble showing the brand’s position reflects the number of posts. In this respect, all the companies we selected are very similar. According to the ratio of likes to comments (like to comment ratio), the best performers are those profiles where this ratio approaches 1.

We decided to analyze the profiles of: Reserved, House, Red is Bad, Cropp, H&M and Monnari. The first four are very similar in terms of Facebook activity, while H&M and Monnari not only stand out from the rest, but are also kind of opposites.
Emotions in fashion brand posts
How different are the various clothing brands? The chart below shows how they compare to the average. For example, a value of 60% for anticipation (orange emotion) in the case of House (black line) means that this company expresses this emotion in its posts that much more often than average. By the same token, -40% joy in the case of Red is Bad (violet) tells us that the brand expresses this emotion significantly less often than others.

Fashion brands create their image on Facebook as environmentally conscious (H&M), very cool (Cropp), elegant and friendly (Monnari), patriotically committed (Red is Bad). The differences between them can also be seen in the results of the sentiment and emotion analysis. Red is Bad expresses a lot of negative emotions: fear, disgust, sadness, anger. Much more than any other company.
House, on the other hand, heavily promotes its future activities while expressing surprise and expectation. Reserved seems to express a very “model” set of emotions, usually staying around the average (0% line) – just what we have come to expect from the communication of an everyday brand, aimed at a very wide audience. Cropp’s profile also has a very similar tone.
Emocje klientów
Facebook is used to communicate directly with the customer, but also with the brand. Observers, private individuals and other companies comment on official posts. What emotions do they express?
Let’s first look at the results of the sentiment analysis. Fashion brands, or rather their customers, seem similar to each other – the differences usually reach 10%, while those between emotions in posts reached 60%. Only Monnari outweighs the others in terms of positive sentiment (20% more than average). House turned out to be a model brand in this comparison, performing at the average level.

Being a model pays off: fashion brands Reserved and Cropp kept their posts within the average intensities of each emotion – and so do those commenting on these statements. Monnari, confirming the results of the sentiment analysis, stands out above the average in terms of joy and anticipation. Perhaps this was influenced by the competition under the slogan “I feel best…”. H&M receives a lot of trepidation in the comments – it’s mostly about complaints and questions about whether it’s possible to buy clothes from the ending collection. The most confidence is expressed by Red is Bad customers.

Fashion brands and their communication with the customer
For now, we know how brands differ. But what about the relationship, fit or rift, between the company and its customers? What is the ratio of emotions in comments to those in posts?

The chart above shows that customers always express more negative sentiment than the brand itself – an expected result. The brand does not complain and complain. But that, among other things, is why it has social media, so that it can quickly receive them from customers and be able to publicly show how efficiently it solves problems. And yet… In the case of Monnari and Red is Bad, this ratio is close to 1, which means that customers complain very little, almost not at all. They are faithful consumers of products and brand statements. What’s fascinating is that these are the only companies where commenters are even slightly more positive than the brand itself.
Fashion brand communication vs customer communication
In the case of Red is Bad, it may be about comments about soccer (the brand talked to observers about the World Cup) and the fact that it itself expresses a lot of negative emotion. However, this trend is observed throughout the year, except for the first quarter, so it is not affected by a single event. In the case of Monnari, we observe satisfied customers writing about when they feel best. We see this trend especially in the third and fourth quarters of 2018.
Finally, our most complicated graph – the relationship between the intensity of emotions in comments and posts. Red color means that a particular emotion appeared in the comments under the company’s posts twice as often. Gray – that it was about the same or a little less.

We immediately see two interesting cases.
H&M has received far more fear than it has expressed – and this has been the case for all quarters of 2018. In addition, commenters also expressed a lot of anger in the first and third quarters of last year – H&M’s customers use the company’s Facebook more often than others to seek help, report problems, and request refunds.
Monnari, on the other hand, shows the opposite, very positive trends. Customers express a lot of joy and (especially in the second and third quarters) expectations in the comments. They are confident that the company and its products are something good, pleasant for them.
We can also observe reverse trends between Reserved and Cropp and Red is Bad when it comes to the emotion of fear. In the case of the first two brands, it is rather expressed by customers. In the case of patriotic clothing – the retailer itself.
Emotions of fashion brands and their customers – conclusions
Monnari and Red is Bad are two brands aimed at completely different target groups. However, they have proven to communicate with their customers most efficiently. They receive positive comments from them, and seem very attuned to their audiences in terms of the tone of their mutual communication.
H&M’s Facebook situation turned out to be the most complicated. This brand received a lot of negative emotion in 2018, although it expressed itself in a moderate way. The other everyday brands and those aimed at a wide audience, Reserved, Cropp and House, stayed around average in both the emotion expressed in posts and that received in comments.
As in the case of banks, it turned out that customers tune into a company’s communications – unless the company lets them down. Then they don’t focus on reading and responding to its communications, but instead express their own opinions, often strongly negative.
Brand monitoring and emotion analysis
This is our next post showing how emotion analysis sheds interesting new light on about various companies in the market. Previously, we examined banks and their Facebook communications. We also examined how various beauty brands are talked about – and which ones are given warmer feelings than others. Sentiment analysis worked well in both the beauty industry, whose representatives differ little from each other, and the heavily diversified entertainment industry.
Sentiment and emotion analysis is a direct insight into the mechanisms that control consumer behavior of customers. That is, our decisions to like something on Facebook, sign up for a newsletter, and finally buy something. If we are not convinced by the emotional overtones of a brand’s communication, if it does not seem sincere to us, we will not want to listen to it. In this study, we found that the customized, out-of-the-ordinary communications of two extremely different companies hit the mark. Their customers wrote a great deal of positive comments on Facebook.

by Agnieszka Czoska | Mar 14, 2019 | Sentimenti research
Each data analysis is aimed at understanding what information it contains. Has something changed, or is there a difference between A and B? Do changes in A correlate with those in C or D? Only these steps allow us to draw conclusions about the results.
First stage: measurement. What is the text?
The above statement also applies to the analysis of emotions or sentiment. Its first stage is the MEASUREMENT, checking how many and what kind of emotions we find in a given text or set of them. The result of a simple emotion measurement shows the intensity of each of Plutchik’s 8 basic emotions supplemented by positive and negative sentiment and arousal (overall emotional temperature of the text). Sometimes we can afford to interpret it already at this stage. We did it in one of our first entries, where we analyzed short ads (what is important, we have already managed to improve the way the results are presented). By analyzing the ads we wanted to show something characteristic for the whole type of texts: the most important emotions are joy and trust, only at the very beginning of the story about the product the creators allow themselves to remember the negative ones – to show the hardships of life before the era of the best shampoo or grease in the world.
The correct results of the Emotional Measurement are those that are consistent with people’s feelings, after all, each of us is an expert on feelings. Our tool owes its correctness to the participants of research on emotions in Polish, which we conducted according to the best scientific standards.

Measurement is only the first step towards understanding the message and the emotions it contains. When we deal with many similar texts or collections of texts, we have to do something else. We want to find out which shop has the best opinions? Which version of our marketing content expresses the most enthusiasm or best shows interest in the subject? Which of the texts in the “Beauty” section will delight, move or warn the reader? We are talking about COMPARISON.
The second stage: comparison. Does this text differ from the average?
Comparison is perhaps the most important stage in the analysis of emotions – thanks to it we not only find out what the text is like, but also how it compares with others. We can compare directly – as we did when writing about lipsticks and lipsticks. Then we were interested in which of the topics has an advantage in terms of positive emotions and whether this difference is statistically significant. However, comparing several or a dozen or so different cosmetic brands cannot be done in this way, it would not be the correct approach. That is why in the text about beauty companies we used a comparison to the average – we needed some kind of background measurement, so-called baseline. This approach will be useful, for example, when comparing shops and brands. We then answer the question which brand has better or worse results than most of the industry.
The most general type of baseline would be the sum of emotions that characterize not only the domain, portal or texts of a given author, but simply language. In linguistics, the so-called Polyanna effect is known, which is that there are more positive than negative expressions in every language. Not only in the dictionary, but also in what we say – this effect expresses quite a general tendency of our minds to spend time and energy rather on pleasant things. In our research we very often see this tendency – joys and trust are emotions that appear in the greatest intensity not only in advertising. The fact that language has its emotional mean all the more reason to draw conclusions only based on comparison and not on the measurement itself.
Third stage: trends. What do emotions do?
The analysis of emotions is also about tracking changes in time, i.e. monitoring emotions. We can check whether sadness or revulsion show a growing trend, i.e. there are more and more of them in statements on a given topic or in the opinions of customers. If we notice a trend, which is statistically significant, we can predict what will happen in the future and if by chance it does not mean an impending crisis (depending on the slope of the trend line).
At this stage it is also possible to go beyond the data from the Sentimenti tools. We started with something simple, accessible and yet untouched by others – we compared the emotional temperatures of mentions of listed companies with the prices of their shares, published publicly. Sentistock is great, it allows you to determine what the investor mood really is and how it translates into stock market fluctuations.
This part of the analysis of emotions depends entirely on who and for what purpose wanted to examine the overtones of the text, the notes, the conversation. We have also managed to show which emotions correlate positively with reactions on Facebook and Twitter – that is, how to write, so that the observers would like to like or comment on the post. However, we might as well ask how emotions correlate with remembering information from the text. Studies on the psychology of emotions, including those conducted by our colleagues from LOBI, indicate that the overtones of the text have an impact on what and how well we remember. Correlation between customer feedback and online store sales? Our tools are designed for this type of research.
Why so many stages?
Emotions were not created for themselves. This is our advisory mechanism: they tell us what action to take. Tversky and Kahneman did not receive the Nobel Prize for their research, but for showing that the consumer, including the stock market, is not rational. This statement tells us two things:
- emotions shape the market,
- we need good tools and methods to study this impact.
Trying to understand the emotions “on the eye” we won’t know more than the average customer wanting to buy a new computer, reading all the available reviews and then deciding on the brand for which he or she has (and had) the warmest feelings. Maintaining scientific standards, checking whether differences and trends are statistically significant and even better correlate with other, harder indicators is the best way to find out. After all, we live in the era of big data and data analysis.

by Agnieszka Czoska | Feb 7, 2019 | SentiBrand
Not only our analyses show from time to time that the more emotions we show, the more we receive from our interlocutors. What’s more, I think everyone knows the basic principle of advertising and marketing: emotions pay off because they generate reactions. On the wave of these beliefs, we decided to check whether actually popular Facebook and Twitter posts are more emotional than those that evoke less liking or commentary.
We used Facebook Insights and Tweet Activity analytics statistics. We focused only on those that tell us about the actual interest in a given post: the number of reactions (likes and comments). We ignored the number of page views and similar “big numbers”. – Emotions do not necessarily affect the algorithms of social media, but they should be the reaction of those who observe a particular channel. Where did we get the data from? Not from the Sentimenti website, we have too few fans so far. But we happen to be familiar with a certain pop-culture portal – the statistics are for posts from Nie Tylko Gry.
Emotions on Facebook
We have collected data from January 2019. The portal has more than 1700 viewers on Facebook, at that time it published about 3 posts a day, including multimedia (e.g. containing film posters), links to its pages, several links to films (mainly trailers). We did not analyze these types of posts separately, we would need much more material to do so. We focused only on the text. The posts evoked 20 likes or 23 reactions on average (3 comments on average). We filtered out the 20 most popular posts and the 20 with the least reactions.
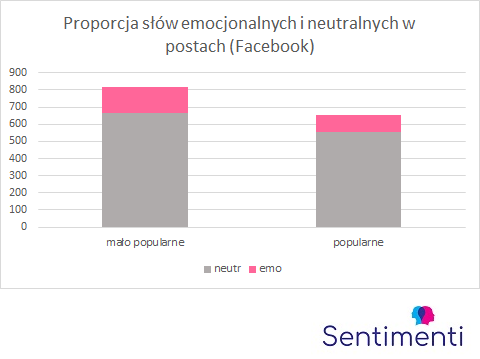
In both types of posts we found less than 20% of emotional words, 15% in the most popular ones and 18% in the second group. This difference is not statistically significant, so the “amount” of emotions alone is not responsible for the popularity of the post.
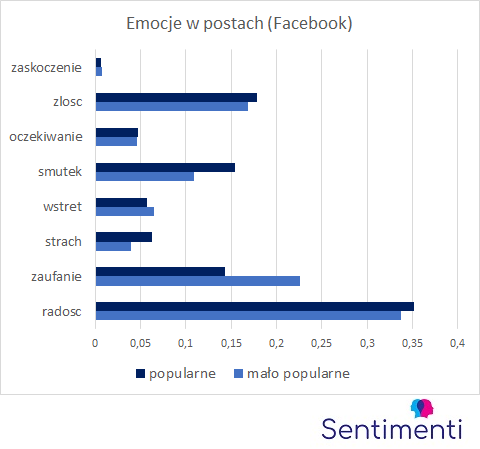
If we look at the distribution of individual emotions, we can see that these two groups of posts differ most in the presence of sadness and trust. If we analyze 8 emotions together, the difference is not statistically significant, but already the set of trust, sadness and anger gives a result that shows the difference between the groups (Chi=13,945; p=0,002). Interestingly, in the most popular posts there are more negative emotions and less trust. Does writing about pop culture feed on criticism? Or maybe doubts about the quality of the promoted works?
Emotion on Twitter
We also analyzed the twitts of the portal, this time in December 2018 and January 2019. The portal has less than 200 observers on Twitter, published, as on Fecebook, about 3 posts a day: photos and links (mainly to its website). On average, they generated 4 reactions to the post (including: likes, comments and sharing). We filtered 60 of the most and least popular posts.
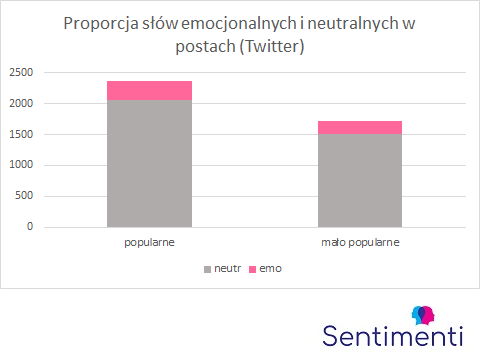
The percentage of words carrying emotion was slightly smaller for twitts, about 13%, and did not differ between the two groups of entries. Interestingly, longer twitts seem to be more popular than shorter ones. However, none of these differences are statistically significant.
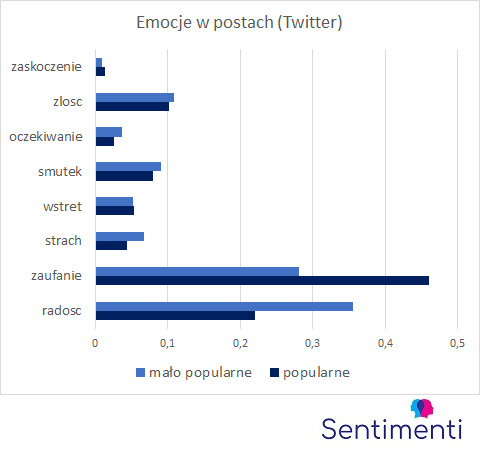
Joy and trust seem to differentiate twitty most strongly. In fact, if we consider these two emotions and fear, we get statistically significant differences between the groups (Chi=8,569; p=0,014), while for 8 emotions the result is not significant and we can only talk about the tendency. In popular twitts trust is more often expressed, and less often – fear and joy.
Emotions in social media
As you can see, Twitter and Facebook posts from the Not Only Games portal we are analyzing show the opposite relationship between emotions and popularity, although on both platforms trust seems to be an important emotion for the audience. It is more important than the ratio of words that carry emotion to neutral. In the case of social media, therefore, the portal cannot simply talk about the influence of emotions on the popularity of an entry, no differences remain relevant if we compare all popular and less popular posts. We have to treat both portals as separate collections of texts to say something about evoking readers’ reactions.
What does this difference mean? Perhaps the author-reader relationship on Twitter and Facebook is different, but the administrator may also be key here – and for “Nie Tylko Gry”, someone completely different deals with each of these channels of communication with the recipients.
In this analysis we have shown that emotions, especially trust, influence the popularity of a post on a social network. At the same time, there is no uniform, valid for all media – on Twitter, positive emotions “won”, and on Facebook, negative emotions. It is also not enough to simply show any feelings – the proportion of emotional to neutral words was not important.
Getting to know your audience is crucial for promotion in social media. In order to encourage interaction with our post, we should find out what our readers, potential clients and supporters actually react to. Do they prefer a photo or text? Probably the first. But do they prefer joy, anger or trust? That’s what we won’t find out from the Facebook algorithms yet. As we have shown, these preferences depend on the communication channel and without reliable data analysis we will not be able to evaluate them.

by Grzegorz Stefański | Dec 21, 2018 | Sentistocks
This time the article was prepared by Grzegorz Stefański, our financial advisor. He proposed to check whether the emotions expressed in the entries about KNF (Financial Supervision Authority) will allow to predict changes in bank indices.
In Brand24 tool we collected data from the period from 1 November to 17 December. As there was not much writing about the Supervision Authority before 13 November, we treated these 12 days as one starting point for data to which we compare further changes in sentiment and emotions expressed by Poles. As can be seen in the chart, before 13, about 200-400 mentions were written daily. On the day the scandal broke out, the number rose to over 20 800 and until today it did not fall below 700 (the least talk was about the KNF on December 5).

The banking sector on the Warsaw Stock Exchange has always been regarded as one of the more stable and relatively insensitive to sudden fluctuations. However, this stable sector is not immune to sudden turmoil, either. For nearly two months now we have been able to follow the events related to the so-called “KNF scandal”. It is clear that the situation in the KNF was very important for the banks’ listing on the WSE in the form of at least two stimulators.
The first one is media information about a conversation between the then President of the KNF and the owner of Getin Bank. The second is the detention of former members of the KNF management. It was November 13th and December 6th respectively. These events had the same resonance for the banking sector. When analysing the changes in the WIG – Banks exchange rate in that period, we notice the following reaction of the stock market with some time delay. This applies to the WIG – Banks quotation on 16 November. On that day, one of the three lowest closing prices in a year (7161.54) was recorded, while on that day the lowest price in a year (7040.86). There can be no doubt that the reason for such a significant decrease was the media information about a conversation between the then President of KNF and the owner of Getin Bank. However, the banking sector itself defended itself with results in the following days, which resulted in an increase in the exchange rate, which was not weakened by reports of the arrest of the President of KNF by law enforcement authorities (this took place on 27 November). In this period, a mini upward trend in the exchange rate is noticeable. However, further information on the arrest of former members of the PFSA management on 06 December resulted in a significant drop in quotations – to the level of 7244.17 (on 11 December).
 Source: bankier.pl
The question should be asked how the bank shares market will develop further? How much more turbulence is it able to withstand without causing negative reactions from stock market investors? Analysts often use the term investor moods – but what really makes up these so-called moods? Certainly, they are positively influenced by economic results, and also undoubtedly by investment safety. But investors are people who, regardless of measurable indicators, are also guided by emotions. The stock exchange is not free of emotions – we have seen it more than once. Also, the recent events related to the PFSA had a direct impact on the banking sector listed on the WSE. These events described by the media evoked certain sentiment and emotions among the recipients, and this could undoubtedly influence their behavior, causing for example the desire to get rid of their values.
At this point it is worth analysing – as a coincidence – the changes in the intensity of sentiment in the texts on KNF compared to the changes in the WIG – Banks exchange rate between 9 November and 17 December 2018.
 Source: bankier.pl / sentimenti
Analysing the above chart one can notice a certain correlation between the changes in the intensity of sentiment in the texts about KNF and the behaviour of investors manifested in the WIG – Banks exchange rate fluctuations. Thus, in a situation when the positive (increase) and negative (decrease) sentiment curves were aiming to cross, it was a certain signal to increase the bank share price. It took place on 16 November and from that day onwards the price rose until 29 November. On that day the sentimentary curves spread out and a short-term price drop was recorded. After that day, the curves entered the convergence phase again and the price went up (until 05 December). On the next day (after information about the arrest of former heads of the Polish Financial Supervision Authority), the exchange rate fell. The sentimentary curves entered a phase of retreat and the exchange rate adopted a downward trend until 11 December. After that day, the sentimentary curves came close, and the exchange rate entered the upward phase again. However, since December 13th, the positive sentiment trend has seen a decrease (and at the same time an increase in negative sentiment), and this may suggest that in the following days there may be another downward correction of bank share prices.
In this analysis, only one element has been adopted which may affect the share price levels of banks listed on the WSE. This element is media information about the situation in the PFSA. However, it already gives some premises to start observing carefully and trying to study the emotions connected with the capital market. A more complete picture can be obtained by conducting broader research, especially of the basic emotions that function in the environment of investment processes taking place on the stock exchange.
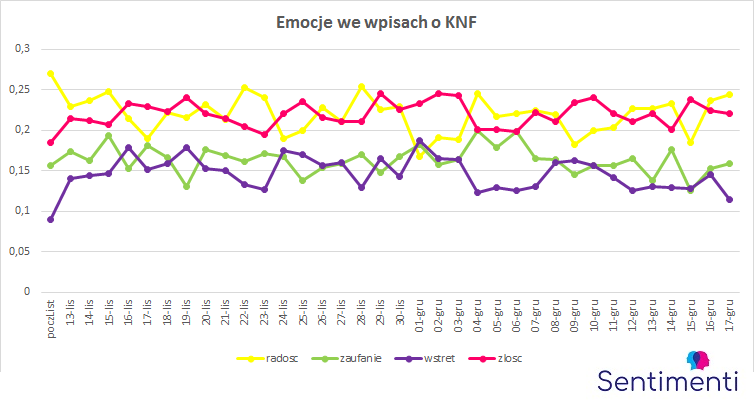
It is still necessary to consider how individual emotions have changed responding to subsequent reports of irregularities in the PFSA and whether they also have predictive power. The graph with the results of the averaged daily emotions indicates, first an increase in the proportion of disgust and anger and a decrease in joy. Strong fluctuations of trust can also be observed. SentiTool as a tool to help predict stock market trends? It seems that this is quite a possible scenario.