
by Sentimenti Team | Nov 22, 2022 | Categorising comments, Market research, SentiBrand
As a strategic global partner of Statista®, we regularly study industries. We publish the results in the form of periodic reports or as requested by the client. They are of great interest among the surveyed companies, as well as their customers.

We have prepared a commercial report analyzing the intensity of emotions evoked among service users by the activities of Polish mobile operators in the period from January 2022.
What you will learn from the report:
- how my company compares to the competition,
- which services cause the most irritation and anger,
- which services your customers love,
- analysis of specific comments for each emotion.
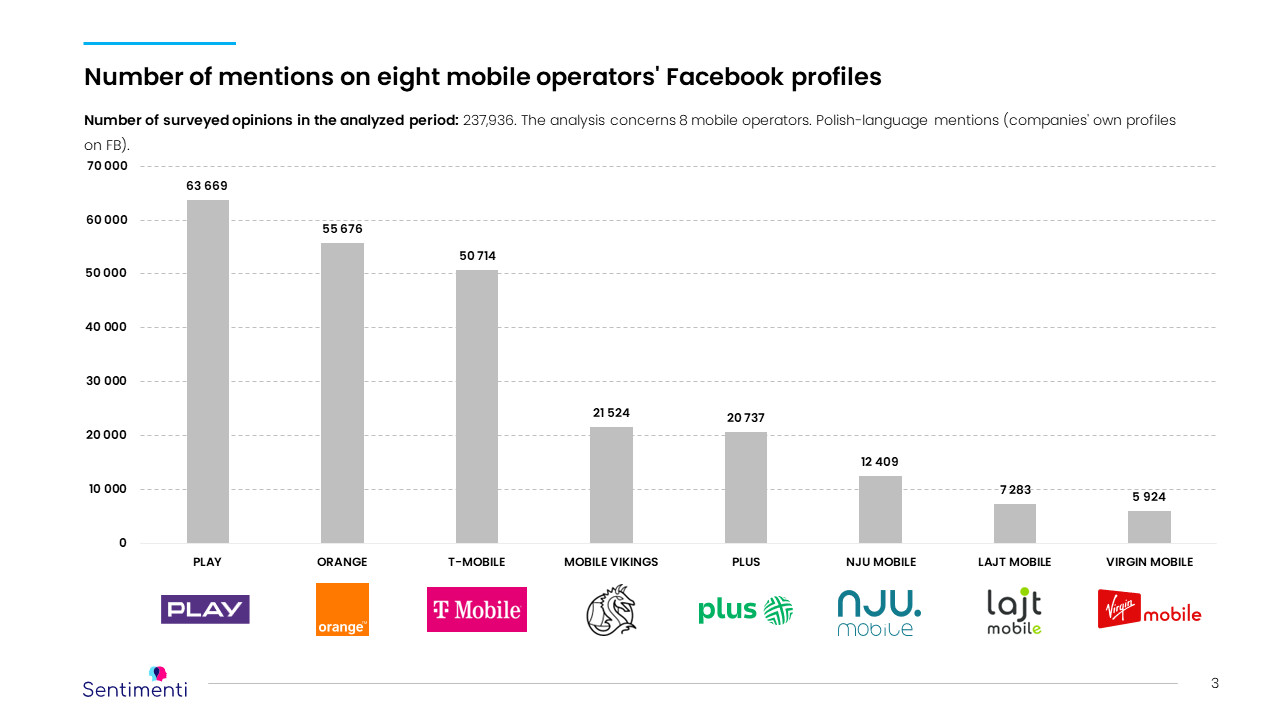
Who was written about the most
The study examined more than 250,000 Polish-language comments and opinions found on the profiles of Play, Orange, T-Mobile, Plus, Nju Mobile, Lajt Mobile, Mobile Vikings and Virgin Mobile. They were posted on Facebook from January 2022.
For starters – the sentiment
The chart shows the differences in the intensity of negative sentiment, positive sentiment and emotional arousal of an operator compared to the other seven companies. In other words, for example, the negative sentiment around operator 1 was 52% higher than the average sentiment measured for the other seven operators combined.
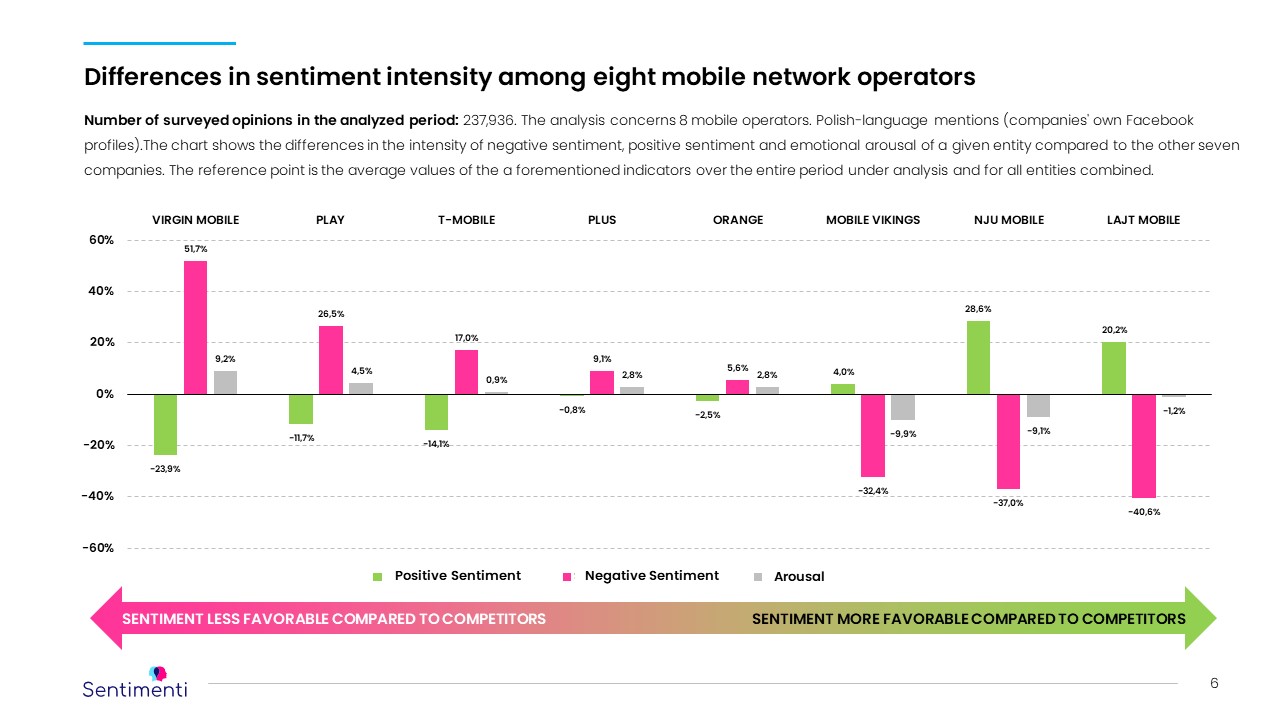
In this presentation, operators’ data have been anonymized (full data are available in the commercial report).
Emotions are more important
The chart shows the differences in the intensities of the selected four emotions in the discussion on a given company’s profile compared to the other seven. That is, similar to sentiment, for example, the intensity of the emotion of anger measured for operator 1 was 39% higher than the average intensity of this emotion measured for the other seven operators combined.
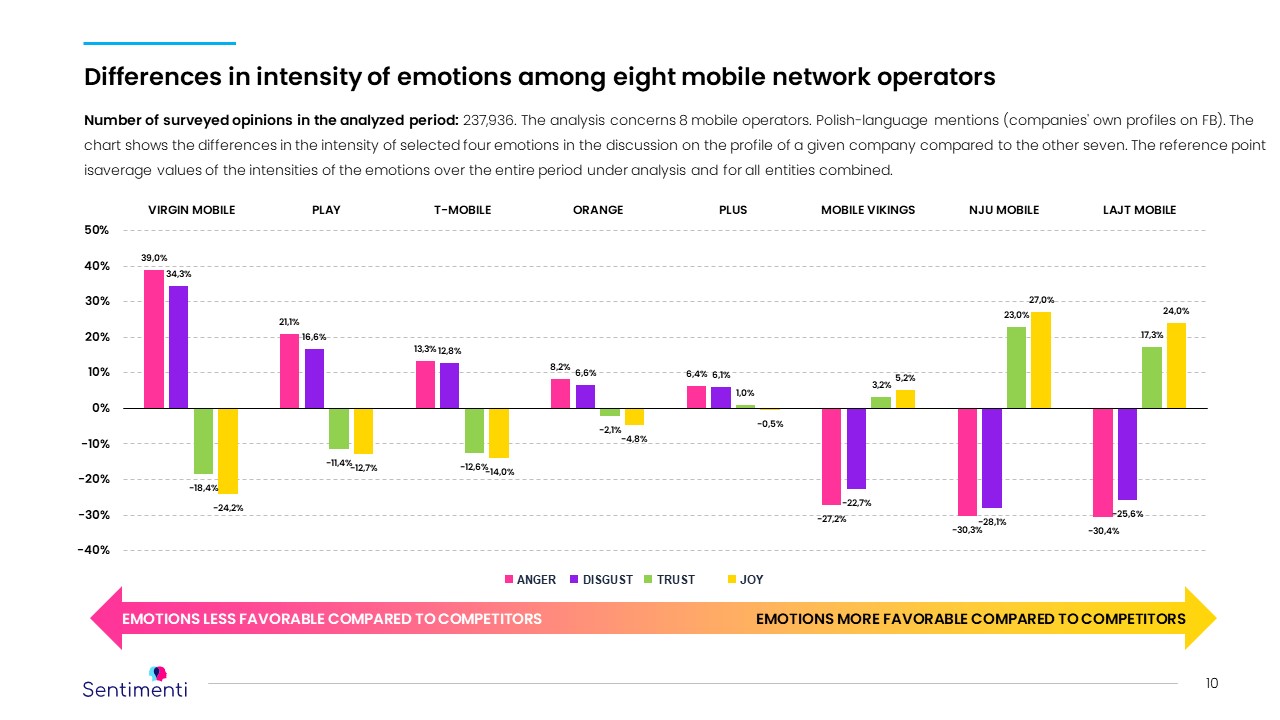
In this presentation, operators’ data have been anonymized (full data are available in the commercial report).
What else you can find in the report
The analyses indicated above are only a small part of the report. It further includes:
- analysis of the total number of mentions,
- analysis of the average intensity of sentiment and arousal for each operator,
- analysis of the average intensity of basic emotions for each operator,
- an analysis of mentions broken down into operator comments and Internet user comments,
- analysis of sentiment and arousal for operator and Internet user comments,
- analysis of contexts and themes in opinion content by emotion (e.g., anger and joy), separately for each operator.
- the most prominent comments in terms of stimulated emotions.
20221101_polish_telekoms_v3_EN
Use our information to improve communication with your customers and improve your service. We can update reports at any set period (even daily).
Our analysts will help you interpret the data so that you get the most out of the information that is important to you and your company…. Get back to us!

by Agnieszka Czoska | Feb 7, 2019 | SentiBrand
Not only our analyses show from time to time that the more emotions we show, the more we receive from our interlocutors. What’s more, I think everyone knows the basic principle of advertising and marketing: emotions pay off because they generate reactions. On the wave of these beliefs, we decided to check whether actually popular Facebook and Twitter posts are more emotional than those that evoke less liking or commentary.
We used Facebook Insights and Tweet Activity analytics statistics. We focused only on those that tell us about the actual interest in a given post: the number of reactions (likes and comments). We ignored the number of page views and similar “big numbers”. – Emotions do not necessarily affect the algorithms of social media, but they should be the reaction of those who observe a particular channel. Where did we get the data from? Not from the Sentimenti website, we have too few fans so far. But we happen to be familiar with a certain pop-culture portal – the statistics are for posts from Nie Tylko Gry.
Emotions on Facebook
We have collected data from January 2019. The portal has more than 1700 viewers on Facebook, at that time it published about 3 posts a day, including multimedia (e.g. containing film posters), links to its pages, several links to films (mainly trailers). We did not analyze these types of posts separately, we would need much more material to do so. We focused only on the text. The posts evoked 20 likes or 23 reactions on average (3 comments on average). We filtered out the 20 most popular posts and the 20 with the least reactions.
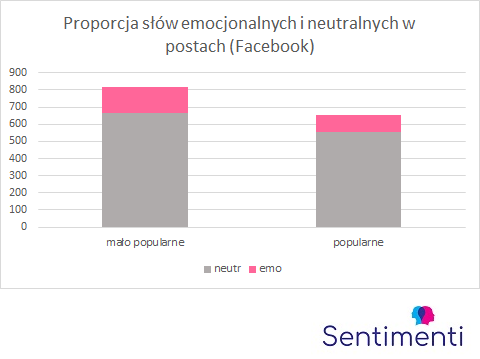
In both types of posts we found less than 20% of emotional words, 15% in the most popular ones and 18% in the second group. This difference is not statistically significant, so the “amount” of emotions alone is not responsible for the popularity of the post.
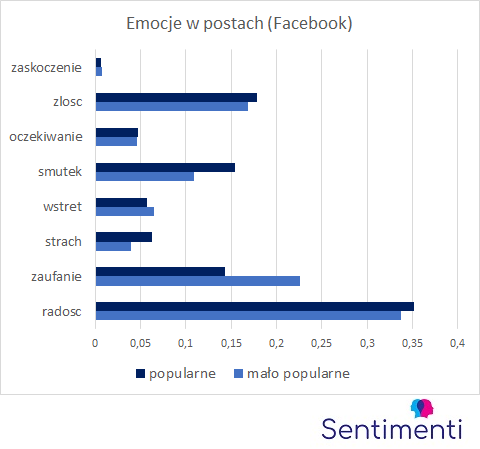
If we look at the distribution of individual emotions, we can see that these two groups of posts differ most in the presence of sadness and trust. If we analyze 8 emotions together, the difference is not statistically significant, but already the set of trust, sadness and anger gives a result that shows the difference between the groups (Chi=13,945; p=0,002). Interestingly, in the most popular posts there are more negative emotions and less trust. Does writing about pop culture feed on criticism? Or maybe doubts about the quality of the promoted works?
Emotion on Twitter
We also analyzed the twitts of the portal, this time in December 2018 and January 2019. The portal has less than 200 observers on Twitter, published, as on Fecebook, about 3 posts a day: photos and links (mainly to its website). On average, they generated 4 reactions to the post (including: likes, comments and sharing). We filtered 60 of the most and least popular posts.
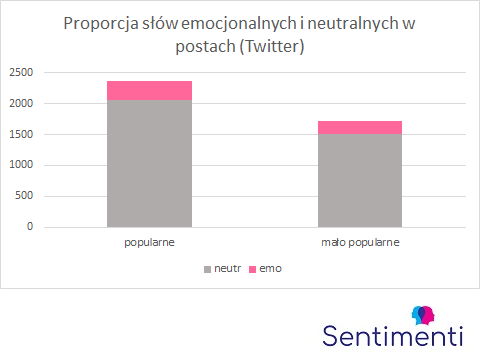
The percentage of words carrying emotion was slightly smaller for twitts, about 13%, and did not differ between the two groups of entries. Interestingly, longer twitts seem to be more popular than shorter ones. However, none of these differences are statistically significant.
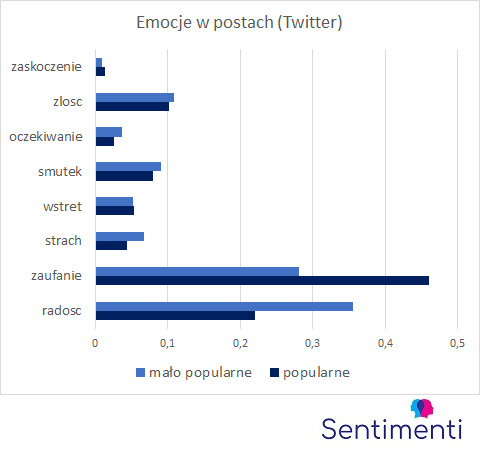
Joy and trust seem to differentiate twitty most strongly. In fact, if we consider these two emotions and fear, we get statistically significant differences between the groups (Chi=8,569; p=0,014), while for 8 emotions the result is not significant and we can only talk about the tendency. In popular twitts trust is more often expressed, and less often – fear and joy.
Emotions in social media
As you can see, Twitter and Facebook posts from the Not Only Games portal we are analyzing show the opposite relationship between emotions and popularity, although on both platforms trust seems to be an important emotion for the audience. It is more important than the ratio of words that carry emotion to neutral. In the case of social media, therefore, the portal cannot simply talk about the influence of emotions on the popularity of an entry, no differences remain relevant if we compare all popular and less popular posts. We have to treat both portals as separate collections of texts to say something about evoking readers’ reactions.
What does this difference mean? Perhaps the author-reader relationship on Twitter and Facebook is different, but the administrator may also be key here – and for “Nie Tylko Gry”, someone completely different deals with each of these channels of communication with the recipients.
In this analysis we have shown that emotions, especially trust, influence the popularity of a post on a social network. At the same time, there is no uniform, valid for all media – on Twitter, positive emotions “won”, and on Facebook, negative emotions. It is also not enough to simply show any feelings – the proportion of emotional to neutral words was not important.
Getting to know your audience is crucial for promotion in social media. In order to encourage interaction with our post, we should find out what our readers, potential clients and supporters actually react to. Do they prefer a photo or text? Probably the first. But do they prefer joy, anger or trust? That’s what we won’t find out from the Facebook algorithms yet. As we have shown, these preferences depend on the communication channel and without reliable data analysis we will not be able to evaluate them.


